Figure 5: Event viewer query web page
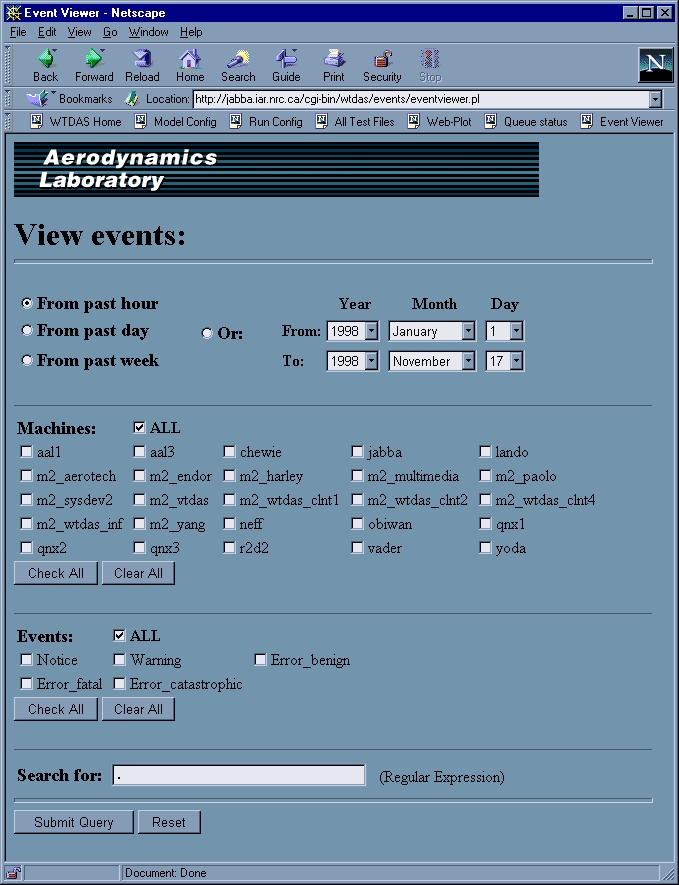
The largest and most complex part of the logging system is the web-based event filter and viewer eventviewer.pl. This script presents a web page (Fig. 5) that allows the user to view events that match a desired set of criteria.
Figure 5: Event viewer query web page
In the top section of the page the user is allowed to set time and date constraints on the search. Radio
buttons are provided for rapid selection of the past hour, day or week, as these are expected to be the most-
used time options. The default is set to the past hour. For other time periods a set of drop-down menus is
provided to select the
From: and
To: dates. By default the
From: date is set to Jan. 1, 1999 and the
To: date is set to the current year, month, and day. If the user changes any of these selectors, the
Or: radio button is automatically checked. Although trivial in appearance, these elements require some special
JavaScript code to adjust the
Day menu when the
Month selector is changed, or when the
Year selector is changed and the month is set to
February.
The middle section allows the user to filter on the names of the computers responsible for the generation of
the events. At run time, the table of names is created dynamically by the script from information contained
in the hosts file on the web server. The
ALL box is checked by default, but any individual selection
will automatically clear this setting. Buttons that activate JavaScript routines are provided to conveniently check or clear all boxes.
The
Events: section is used to filter for specific severity levels. The list is created using the descriptions
from Notabene.pm. As above, the
ALL box is the default.
The last form-input element, the
Search for: text box, allows the user to enter a search string to use as a
filter. Since this string is interpreted as a regular expression, complex search patterns may be specified
rather succinctly. The default is set to
. which is the regular expression that matches any character except
newline.
When satisfied with the filter settings, the user presses the
Submit Query button and the request is sent back to
eventviewer.pl for processing. The script converts the time entries to UNIX format and passes the
search criteria to the getevents() subroutine where the names of the log files covering the requested time
period are generated. These files are then searched for events that conform to the user�s request, and an
array is generated of the positive matches. This array is passed back to the main script, where it is used to
generate an HTML table.
The result of using eventviewer.pl is a web page containing a list of events that satisfy the search criteria
(an example is illustrated in Fig. 6). For ease of recognition, the event levels are converted to icons: a blue
circle with question mark for level 0, a yellow �yield sign� with exclamation point for level 1, and a red
�stop sign� with one, two or three exclamation points for levels 2, 3 and 4. The background colour of the
text areas is also modified to match the icon colour. In addition, a count is kept of the number of events for
each severity level as well as the total event count. This information is written to the page using the HTML
<alt> tag of each image and may be viewed by resting the cursor on the event�s icon. In order to
reduce the size of the table, the name of any computer that ends with the divisional domain
iar.nrc.ca is reduced to the machine name alone.
Along with a button to go back to enable another search, a button has been provided that will download the
event list to the user�s computer in �comma separated values� (.csv) format. This allows for further
manipulation of the information using a local spreadsheet or word processing program.
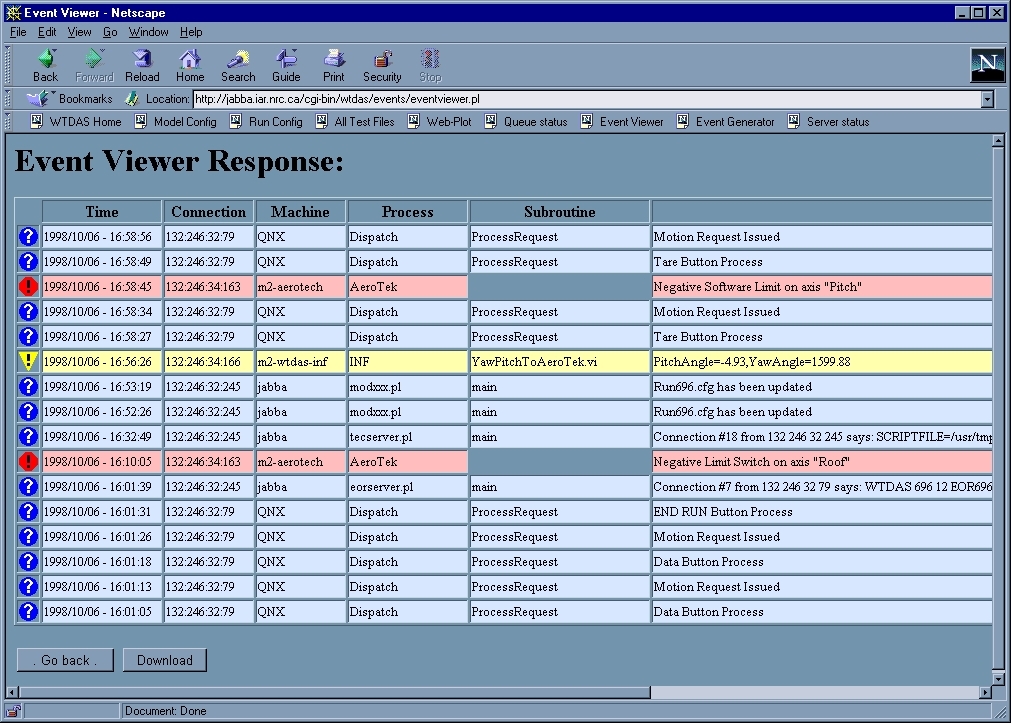
Figure 6: Event viewer response web page